Display Line Chart Using Chart.js MVC C#
In this Section We See about How to Display Line Chart Using Chart.js in MVC C# Jquery , Ajax Services. Already we seens Chart.js PieCharts and Doughnut Chart. In this section I am Using Sql Server Databse and Create One Ajax Services For Data Get. and Using Chart.js Tool.

View Page:-
@{
Layout = null;
}
<!DOCTYPE html>
<html>
<head>
<meta name="viewport" content="width=device-width" />
<title>DisplayLineChart</title>
<script src="https://code.jquery.com/jquery-1.12.4.js"></script>
<script src="~/Scripts/ChartJs/charts/Chart.bundle.min.js"></script>
<script type="text/javascript">
$(document).ready(function () {
Disp();
});
function Disp() {
var
dataPts = [];
var
xPts = [];
var
yPts = [];
$.ajax({
cache: false,
async: false,
type: "POST",
dataType: "Json",
contentType: "application/json;
charset=utf-8",
url: "/chartjsLineChart/DispRec",
data: {},
success: function (data) {
var len = data.length;
for (var i = 0; i < len; i++) {
xPts.push(data[i].yVal);
yPts.push({
y:
parseFloat(data[i].yVal)
});
}
var config = {
type: 'line',
data: {
labels: xPts,
datasets: [{
// backgroundColor:
window.chartColors.red,
//borderColor:
window.chartColors.red,
data: yPts,
fill: false,
}]
}
}
var ctx = document.getElementById("divchart").getContext("2d");
window.myLine = new Chart(ctx, config);
},
error: function (result) {
alert(result);
}
});
}
</script>
</head>
<body>
<canvas id="divchart"></canvas>
</body>
</html>
Controller :-
using System;
using System.Collections.Generic;
using System.Configuration;
using System.Data;
using System.Data.SqlClient;
using System.Linq;
using System.Web;
using System.Web.Mvc;
namespace Chartsprojects.Controllers
{
public class ChartjsLineChartController : Controller
{
//
// GET:
/ChartjsLineChart/
public ActionResult DisplayLineChart()
{
return View();
}
public class Det
{
public int Id;
public decimal xVal;
public decimal yVal;
}
public JsonResult DispRec()
{
SqlConnection cn = new SqlConnection(ConfigurationManager.ConnectionStrings["blogger"].ToString());
List<Det> obj = new List<Det>();
cn.Open();
DataTable dt = new DataTable();
SqlCommand cmd = new SqlCommand();
SqlDataAdapter da = new SqlDataAdapter("select * from
mLinechartData",
cn);
da.Fill(dt);
cn.Close();
foreach (DataRow dr in dt.Rows)
{
Det def = new Det();
def.Id = Convert.ToInt32(dr[0].ToString());
def.xVal = Convert.ToDecimal(dr[1].ToString());
def.yVal = Convert.ToDecimal(dr[2].ToString());
obj.Add(def);
}
return Json(obj, JsonRequestBehavior.AllowGet);
}
}
}
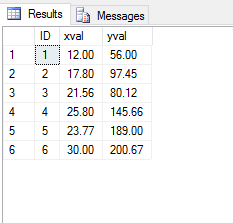
Database Table:-
Chart:-


Comments
Post a Comment
Thank You for your Comment