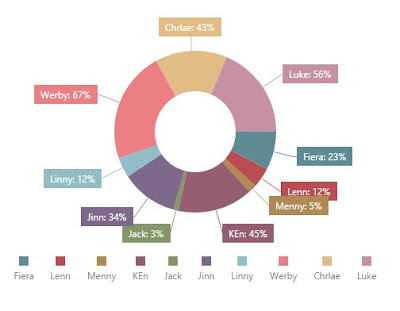
Display Doughnut Chart Using DevExpress and WebAPI
In this Charts Using Web API To Know How to Value Get Value from Api .
Charts:
Code
Table

Charts:

Code
<!DOCTYPE html>
<html>
<head>
<meta name="viewport"
content="width=device-width"
/>
<title>DoughnutChartDisplay</title>
<script src="jquery-2.2.3.min.js"></script>
<script src="dx.viz-web.js"></script>
<script type="text/javascript">
$(function () {
$.getJSON('http://localhost:50879/api/name/getname',
function (data) {
$("#container").dxPieChart({
dataSource: data,
legend: {
horizontalAlignment: "center",
verticalAlignment: "bottom"
},
"export": {
enabled: true
},
series: [{
type: "Doughnut",
argumentField: "Name",
valueField: "Value",
label: {
visible: true,
format: "fixedPoint",
customizeText: function
(point) {
return point.argumentText + ":
" + point.valueText + "%";
},
connector: {
visible: true,
width: 1
}
}
}]
});
})
});
</script>
</head>
<body>
<div id="container"></div>
</body>
</html>
API Result:
[
{
"ID": 1,
"Name":
"Fiera",
"Value": 23
},
{
"ID": 2,
"Name":
"Lenn",
"Value": 12
},
{
"ID": 3,
"Name":
"Menny",
"Value": 5
},
{
"ID": 4,
"Name":
"KEn",
"Value": 45
},
{
"ID": 5,
"Name":
"Jack",
"Value": 3
},
{
"ID": 6,
"Name":
"Jinn",
"Value": 34
},
{
"ID": 7,
"Name":
"Linny",
"Value": 12
},
{
"ID": 8,
"Name":
"Werby",
"Value": 67
},
{
"ID": 9,
"Name":
"Chrlae",
"Value": 43
},
{
"ID": 10,
"Name":
"Luke",
"Value": 56
}
]


Comments
Post a Comment
Thank You for your Comment